V Reshma, Research Scholar, Department of Economics ,The Gandhigram Rural
Institute DTBU, Gandhigram, Tamil Nadu.
Reji Krishna, Assistant Professor, Department of Commerce, Sree Narayana College,
Alathur, Palakkad, University of Calicut &
Research Scholar, Government Arts College, Thiruvananthapuram, Affiliated to
University of Kerala.
Mohandas V. K., Assistant Professor, Department of Economics, Government Victoria
College, Palakkad, Kerala.
Dr. Sajeev H., Associate Professor and Research Supervisor, Government Arts
College, Thiruvananthapuram, Affiliated to University of Kerala.
ABSTRACT
GM, AI, FDI, and Tr have a positive effect on the stock market, whereas Ex and In have a negative effect. However, DC has a positive but insignificant impact. While in the short run, all factors except trade have a positive impact on SM in BRICS nations. These panel ARDL results were further validated by employing Augmented Mean Group (AMG) and Common Correlated Effects Mean Group (CCEMG). The findings suggested that policymakers should concentrate more on investment policies focusing on green finance and integrating AI techniques for the development of the stock market.
KEYWORDS: Artificial intelligence; FDI; green finance; panel ARDL; stock market; trade
INTRODUCTION
The stock markets of the BRICS nations—Brazil, Russia, India, China, and South Africa—have grown significantly during the last 10 years. It is anticipated that the BRICS member countries’ growth rates would accelerate in the near future, possibly overtaking the US and European combined growth rates by 2030 (Ganguly & Bhunia, 2022). The BRIC taxonomy was first developed by Goldman Sachs to characterise Brazil, Russia, India, and China—a collection of large emerging economies with significant potential for growth. Following the group’s official formation in 2006, the first BRIC summit took place in 2009. When South Africa joined in December 2010, the
group saw its first expansion, becoming known as BRICS (Toloraya, 2018). The BRICS group has become one of the most important economic blocs in the past decade, accounting for around 42% of the world’s population, 26% of the global GDP, 21% of exports, 16% of global imports (Larionova, 2020). Despite being an unofficial organisation without a charter, the bloc has a more institutional character because to high levels of political engagement and the establishment of economic institutions like the New Development Bank. There is some co-movement among the BRICS markets due to the countries’ increasing political and economic relations (Lehkonen & Heimonen, 2014). A uniform platform for trading stocks is provided by the stock market (Voit, 2013). While institutional investors can make significant investments, individual investors can benefit
from the trading conveniences (Enisan & Olufisayo, 2009). The economy’s money flow is facilitated by the stock market. It also makes the market more liquid and creates an environment that is favourable to IPOs and entrepreneurship. According to Levine and Zervos (1999), the size of the stock market plays a major part in stabilising the ways in which money may be obtained to better support investments and economic growth. Any economy that wants to transition from a traditional, rigid, and risky bank-based economy to one that is more flexible, safe, and resistant to shocks, volatility, and a lack of investorconfidence must have it. Numerous studies examine the integration of global stockmarkets. Despite some indications that China is increasingly fragmented, Nayyar (2020) and Dsouza et al. (2024) demonstrate interconnectedness within the BRICS economies. For instance, Sharma et al. (2013) used the variance decomposition test and VAR model to identify interdependencies across the BRICS stock market based on daily data from
April 1, 2005, to March 31, 2010. Using wavelet multiple correlation and daily data from January 4, 2005, to February 28, 2012, the researchers discovered that the chosen nine Asian countries were highly connected (Tiwari et al., 2013). Wu (2020) shows that estimations of stock market integration across developing economies can be significantly skewed if the influence of global market forces is ignored.
At the same time, economic theory and empirical study have long been interested in and investigating the connection between macroeconomic variables and stock prices. Research has continuously acknowledged market indices and stock prices as valid indicators for evaluating economic conditions (Abbass et al., 2022). Stock market prices are strongly impacted by a nation’s economic circumstances (Riaz et al., 2022). The stock market is also significantly impacted by macro factors, including GDP, interest rates, exchange rates (ER), and inflation (Gyamfi et al., 2021).
In the resent time, there are few literatures stating the impact of green bonds, that is green finance effects the stock market. In general, green financing plays a key role in positioning the regional economy as a high-quality, low-carbon, and environmentally friendly growth path (Wang and Zhou 2022). It has been recognised that green finance is an essential tool for raising the funds required to assist ecologically friendly initiatives and businesses (Li and Lin, 2024). Yu et al. (2023), for instance, emphasize the vital role that green financing plays in reducing environmental hazards and encouraging sustainable industrial practices, especially in emerging economies. Certification exam administration plays a crucial role in preventing “green-washing,” which in turn lessens the risks connected to green expenditures for businesses. Furthermore, funding allocations to companies with high energy usage and pollutant emissions may decline as green financing develops. Redirecting financial resources to environmentally friendly and energy-efficient businesses is in line with ecological goals and creates a new strategicparadigm for financial institutions. This change reflects the ideas of sustainable economics and emphasises how important financial intermediaries are in encouraging ecologically conscious investing practices (Iram et al., 2020). This all effect the stock market of the any countries. BRICS nations being the fast growing economies, its stock market will be impacted by the green finance. Given the preceding circumstances, the main goal of this research is to investigate how the stock market (taking the stock traded as a proxy) is affected by the financial factor, namely green finance, technological factor, namely artificial intelligence (taking the patent application as the proxy), external factors (FDI, trade openness, and exchange rate), and internal factor (inflation), specifically in the context of BRICS nations. This study adds to the body of knowledge in several ways. First, there is a lack of research using the ARDL approach to investigate the short- and long-term effects of the aforementioned factors in BRICS nations for a period from the 2000s when the impact of technology became more visible in the stock exchange. Second, the study adds green finance and artificial intelligence as a factor affecting the stock market, which has been lacking in earlier research. Additionally, the research will offer some potential recommendations on the basis of the findings.
MATERIALS AND METHODS
(WDI) (World Bank, 2024). Additionally, data regarding artificial intelligence and green finance (GF) were sourced from the OECD statistics database. The stock market (SM) is the dependent variable in the current study. In the current study, FDI, Tr, and stock traded were measured in terms of current US$ and inflation is calculated as consumer price (annual percentage), whereas the exchange rate is measured in terms of LCU per US$, period average. The OECD’s patent databases, which offer comprehensive information on patent filings categorised by technological disciplines, including AI-related advancements like machine learning, robotics, and data analytics, are the source of the AI variable, which is defined as patents for technologies related to artificial intelligence. For, green finance, we have taken data related to Environmentally related government R&D budget, percentage total government R&D. For all our data analysis and econometric modelling, we used EViews 12, an exhaustive econometric software. To ensure that the data was normally distributed, the factors were converted into logarithms. Table 1 provides a detailed overview of factors used in the study, together with information on sources, rationale, unit of measurement, and data description.
Model specification
The panel ARDL model was employed for accomplishing the objectives, and similar models were used by studies such as Raihan et al. (2024), who focus on how AI affects the environment in G7 nations, and Joo and Shawl (2023), which focused mainly on the influence of FDI on economic growth along with trade, stock market capitalisation, and inflation as a few other important factors in BRICS nations. The present investigation employs the following model, which is an alternative and extended version of the model used by Raihan et al. (2024) and Joo and Shawl (2023), and this
serves as the theoretical foundation. In this regard, we use the following equation.
SMit = f(GFit, AIit, FDIit, Trit, Exit, Init, DCit)
- Where,
SMit = Stock traded
GFit = Green Finance
AIit = Artificial Intelligence
FDIit = Foreign direct investment
Trit = Trade Exit = Exchange rate Init = Inflation
DCit= Domestic credit ‘t’ represents ‘time’, ‘i’ represent ‘observation’ and ‘f’ represent ‘function’. From the equation (1), we derive the equation (2)
SMit = GFit α1,AIit α2. FDIit α3. Trit α4. Exit α5. Init α6. DCit α7. vt
(2)
The following questions are the main focus of this investigation. Are BRICS nations stock markets affected by the aforementioned factors? What kind of effect does it have on the stock market? Previous research has shown contradictory results. For instance, Zhang and Ding (2023) has found that green finance has a negative impact on stock market development of China. In the research focusing on India, insignificant results are observed in the long-term impact of inflation and exchange rate on the stock market applying the ARDL model (Tejesh, 2024). Whereas Sreenu (2023) found a significant positive impact of exchange rate and inflation in the long run and a negative impact in the short run on the stock market in India. In the study, Qamruzzaman and Wei (2018) identified a long-term correlation among the variables, such as financial development
(application of technology) and stock market development. In the context of Brazil, Nyasha and Odhiambo (2020) found that exchange rates and trade have a positive and significant impact on the growth of the stock market. The fluctuation of the BRICS stock indexes, both past and currently, is significantly impacted by changes in exchange rates (Caporale et al., 2015; Mroua and Trabelsi, 2020). However, there are no studies that have been undertaken to study the impact of artificial intelligence on the stock market in the BRICS nations using a high-end model like panel ARDL. By examining data from 2000 to 2022, this study attempts to fill these gaps and provide a thorough grasp of these factors determining the development of the stock market.
Unit root test
Unit root tests are often employed to test the stationarity of the factors used in the analysis. As described in the research of Joo et al. (2023), a data set is considered to be stationary if the average, variance, and covariance of the data are constant. In the current research, Im, Pesaran, and Shin (IPS), which has been introduced by Im et al. (2003), and LLC (Levin, Lin, and Chu) tests developed by Levin et al. (2002) are the first-generation unit root tests, and CIPS and CADF second-generation unit root tests, which take intoconsideration slope variation and cross-sectional dependency created by Pesaran (2007), were employed. Such similar tests were employed in the research undertaken by Raihanet al. (2024).
Null hypothesis: There is a unit root, or the factors of the series are not stationary.
Panel cointegration
The Pedroni panel cointegration test is used to detect if cointegration exists, assuming panel heterogeneity. Pedroni (1999) produced two distinct assessments. Panel v statistics, panel rho-statistics, panel PP-statistics, and panel ADF-statistics are the four statistical measures used in the first test, which follows a within-dimension methodology. Three statistical measures—group statistics, group PP statistics, and group ADF statistics—as well as a between-dimension approach are used in this experiment. The null hypothesis, according to which there is no cointegration, is rejected if the p-value for each of these data points is less than the designated significance threshold.
Panel ARDL
In the present research, the development of stock market is linked to financial factor such as green finance (ii) technology factor such as artificial intelligence, (iii) open economy factor such as FDI, trade, exchange rate and (iv) internal factor such as inflation and domestic credit. The empirical model states that stock market development (taking stock traded as proxy) is a function of these technological, open economy factor as well as internal factor. In order to determine the relationship between stock market development and these explanatory factors, the study employs the following.
Where α0 is the intercept of the model, α1 to α7 are the coefficient that quantify the impact of explanatory factors in the dependent variable. Additionally, we convert our model to logarithmic form in order to prevent heteroskedasticity and autocorrelation (Hassan and Muhammed, 2024).
Pesaran et al. (2001) developed the autoregressive distributed lag model, which is employed in this study, and it is more effective than any other cointegration technique (Panpoulou and Pittis, 2004). Both short- and long-run dynamics between the variables can be analyzed using the ARDL model when the independent variables in the model are I (0) and I (1) or jointly integrated (Fosu and Magnus, 2006). It is appropriate for time series data as it enables the inclusion of both stationary and non-stationary variables in this analysis (Fosu and Magnus, 2006). The current study employed panel ARDL. The primary justification for using panel data is that it assesses the impact collectively rather than individually, meaning that by adopting a panel perspective, relatively little information is lost (Baltagi, 2008). Furthermore, heteroscedasticity is not a problem in panel data analysis as panel data minimises the noise originating from the individual time series (Ahn et al., 2013). Additionally, panel data is most appropriate in situations when data availability is a problem, especially in developing nations where short-term variables are accessible (Khelfaoui et al., 2022). By accounting for subject-specific factors and dynamic changes brought on by repeated cross-sectional observations, panel estimate approaches account for this heterogeneity. Heterogeneous panel data modelling, or panel-ARDL, is the only focus of this work. Due to its ability to analyse both short term and long-term dynamics between technological, open economy, and internal factors, the Panel Autoregressive Distributed Lag (ARDL) approach is well suited for this study on the BRICS countries’ advancing stock market development. In order to capture the
distinct economic and technical landscapes of the BRICS countries, this approach must take into account variability across cross-sections. In contrast to conventional panel data techniques, Panel ARDL addresses the possibility of various temporal dynamics within each nation by permitting varying lag lengths for every variable. Furthermore, as is typical in financial and macroeconomic datasets, Panel ARDL excels at managing variables with mixed integration orders (I(0) and I(1)). The dependent-independent variable relationship was determined via the following model.
InSMt = α0 + α1LnSMt + α2LnGFt + α3LnAIt + α4LnFDIt + α5LnTrt + α6LnExt + α7LnInt
+ α8LnDCt + vt
Equation (3) may be expressed as follows in ARDL form:
ΔLnSMt = α0 +∑ α 𝑛1
𝑖=1 1i LnSMt-i +∑ α 𝑛2
𝑖=1 2i ΔLnGFt- I + ∑ α 𝑛3
𝑖=1 3i ΔLnAIt- i+ ∑ α 𝑛4
𝑖=1 4i
ΔLnFDIt- i + ∑ α 𝑛5
𝑖=1 5i ΔLnTrt-i + ∑ α 𝑛6
𝑖=1 6i LnExt -i + ∑ α 𝑛7
𝑖=1 7i LnInt -i + ∑ α 𝑛8
𝑖=1 8i ΔLnAIt- I +
β1LnSMt-1 + β2LnGFt-1 + β3LnAIt-1 + β4LnFDIt-1 + β5LnTrt-1+ β6LnExt-1 + β7LnInt-1 +
β8LnDCt-1 + et
(4)
When α0 represents a drift component, Δ indicates the first difference between the
variables, and et is the white noise error term. According to Gujarati (2009), the term“white noise error term” refers to an uncorrelated random error term with zero mean and constant variance σ2. In equation (4), the coefficients from 2nd to 8th (α1i to α8i) suggest an association in short-term and long-term relationships, as shown by the coefficients from 9th to 16th (β1 to β8). Utilizing the ARDL bounds testing technique, the long-term relationship between the variables is investigated. The F statistic is used in the bounds testing method to evaluate the hypothesis. This may be stated as follows.
H0: There is no cointegration. (β1= β2= β3= β4=β5=β6=β7=β8)
H1: Cointegration exists. (β1≠ β2≠ β3≠ β4≠ β5 ≠ β6=β7=β8)
If the computed f statistic is greater than the upper bound value, the null
hypothesis is rejected. The null hypothesis cannot be rejected if the computed f statistic
is less than the lower bound of the critical value. We are unable to draw any conclusions
if the f statistic falls between the critical values of the lower and upper bounds. On the
other hand, the assumption made by Pesaran et al. (2001) allows for the introduction of
an unrestricted error correction model, where the long-run elasticities are the negative
coefficients of a one-lag dependent variable. The ECM version of the ARDL model is
represented as follows.
ΔLnSMt = α0 +∑ α 𝑛1
𝑖=1 1i LnSMt-i +∑ α 𝑛2
𝑖=1 2i ΔLnGFt- I + ∑ α 𝑛3
𝑖=1 3i ΔLnAIt- i+ ∑ α 𝑛4
𝑖=1 4i
ΔLnFDIt- i + ∑ α 𝑛5
𝑖=1 5i ΔLnTrt-i + ∑ α 𝑛6
𝑖=1 6i LnExt -i + ∑ α 𝑛7
𝑖=1 7i LnInt -i + ∑ α 𝑛8
𝑖=1 8i ΔLnAIt- I +
ℽECt-1+et
….…(5)
Where ℽ represents the speed of adjustment and EC are the residual obtained from equation (5).
Robustness check
The robustness was evaluated in the paper using the DKSE, CCEMG, and AMG
estimators. In addition to the residuals, Driscoll and Kraay (1998) employed the average
values of the explanatory variable outcomes. Second, in the current study, we used the
augmented mean group (AMG) estimator, which was proposed by Eberhardt and Teal
(2010). Because the AMG estimator accounts for the CSD, mixed-order stationarity, and
heterogeneity in the panel data, it produces more trustworthy results than first-generation
estimators. The third estimator used in this work is the CCEMG approach, which was
created by Pesaran (2006). Furthermore, both AMG and CCEMG perform better when
estimating using common components that are uncertain and inconsistent. By taking into
consideration temporal changes with varying factor pitches, the CCEMG resolves the
identification problem.
RESULT AND DISCUSSION
Slope Homogeneity Test
The results of the Pesaran and Yamagata (2008) slope homogeneity test are shown in Table 3. The delta statistics are highly significant. Hence, the null hypothesis of slope homogeneity is rejected. In other words, the slopes in the panel data model are not uniform among the cross-sectional units. This means the influence of the exogenous variable on the endogenous variable (stock traded as a dependent variable in the current study) varies, leading to a slope heterogeneity issue.
Panel Unit root test
The findings of panel unit root tests, both the first generation (Levin, Lin, and Chu) as well as the second generation (CIPS and CADF), are shown in Table 4. Due to the high p-value (more than 0.05), the factors such as stock traded (LnSM), trade (LnTr), inflation (LnIn) and domestic credit (LnDC) exhibit non-stationarity at the level, which falls short of the critical value needed to reject the null hypothesis of unit root at the level in both first generation and second generation. The null hypothesis of a unit root is rejected for these factors having significant t-statistics and low p-values (less than 0.05) when first differenced. After differencing once, these factors are stationary. However, the factors such as LnGF, LnFDI, LnAI, and LnEx indicate stationarity at level in both the generation test. Therefore, for further analysis, the variables LnSM, LnTr, and LnIn are converted to first differences.
Panel Cointegration
The findings of Pedroni’s cointegration test, which was used to determine whether there was a long-term connection between the variables, are displayed in Table 5. Two sets of substitute theories are assessed: Common autoregressive coefficients within the dimension (ii) and individual autoregressive coefficients between dimensions (iii). Despite being statistically insignificant, the panel v-statistic and rho-statistic are both negative, suggesting conflicting evidence for a long-term relationship. Nonetheless, the highly significant panel PP-statistic and panel ADF-statistic results show that the no cointegration hypothesis is strongly refuted. Furthermore, the significantly negative Group PP and Group ADF statistics clearly contradict the null hypothesis that there is no cointegration between panels. The group rho-statistic is positive but not significant if individual autoregressive coefficients between dimensions are assumed. Although there may be some variance in the autoregressive coefficients within and between dimensions, these results typically demonstrate that there is evidence of cointegration across the variables in the panel dataset.
Panel ARDL
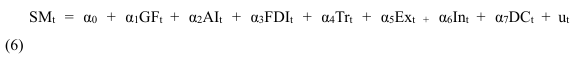
Employing the panel ARDL technique, the study identified the long-term and short-term impacts of explanatory variables such as LnGF, LnAI, LnFDI, LnTr, LnEx, LnIn and LnDC on the dependent variable LnSM. Table 6 presents the long-term results of the panel ARDL approach. Green finance (LnGF) has a positive impact on the stock market (LnSM) in the long term, with a coefficient value of 0.42 indicating that 1 percent rise in the LnGF, woulf increase the growth of stock market by 0.42 percent. This was supported by the existing studies such as Li and Lin (2024) and Zhang and Ding (2023). This may be due to the fact that By promoting sustainable investments and increasing investor trust in ecologically conscious businesses, green financing has a beneficial effect on the stock market. Green practices draw ESG-conscious investors, which raises demand and stock
values as more companies implement them. Green bonds and government incentives encourage investment in sustainable industries, which fosters long-term growth and innovation. This change strengthens the resilience of financial markets, lowers environmental risks, and supports global climate objectives. Overall, by balancing financial gains with environmental responsibility, green finance not only promotes ecological sustainability but also enhances stock market performance and stability.
Artificial intelligence (AI) developments are a contributing factor to the rise in stock market activity, as seen by the positive and significant long-term coefficient of LnAI.
A 1% increase in AI leads to 0.36% increase in stock traded (SM) illustrates how AI may improve trading efficiency, decision-making, and market analysis. Faster transactions, greater risk assessment, and enhanced investing strategies are made possible by AI driven algorithms, which also increase market liquidity and draw in more players. This increase in the use of AI encourages trading volume and increases investor confidence. AI’s revolutionary influence on financial markets and long-term economic growth is therefore highlighted by the close connection between it and stock market activity. These results were in line with the studies by Mohanram (2005) and Pagliaro (2023), who reported that AI has a positive role in the development of the stock market. Similarly,
FDI has a positive and significant effect on LnSM; a 1 percent increase in LnFDI increases LnSM by 0.34 percent. Adediran (2023) found a similar results. The stock market (LnSM) benefits greatly from foreign direct investment (FDI); for instance, a 1% increase in LnFDI causes a 0.34% increase in LnSM. This relatiosnhip illustrates how foreign direct investment (FDI) boosts investor confidence, attracts money, and promotes economic growth—all of which in turn boost stock market activity. Improved infrastructure, knowledge transfer, and job creation are frequently the results of FDI,
which improves business performance and draws in further capital. Foreign investors’ involvement in local markets boosts trade volume and liquidity, which supports long term financial and economic growth and strengthens the stock market. A higher level of trade activity improves stock market performance, according to the positive and substantial long-term coefficient of trade (LnTr). The stock market (LnSM) rises by 0.21% for every 1% increase in LnTr, indicating that more trading improves market liquidity and participation. Stronger economic activity is reflected in higher trade volumes, which boost investor confidence and company performance. As a result, trading volumes and market capitalisation increase as more local and foreign investors
participate in the stock market. All things considered, more trade promotes economic integration, draws in investment, and fortifies the depth and effectiveness of the financial system. This was consistent with the findings of Dino (2023), which showed that a rise in trading volume had a beneficial impact on the stock prices of businesses that are part of the S&P 500 index. With a coefficient of -0.11, the exchange rate (LnEx) and stock traded (LnSM) have a negative long-term connection, indicating that currency depreciation deters stock market activity. Lesser trade volumes and capital outflows result from foreign investors receiving lesser profits as the local currency declines.
Additionally, it increases the cost of imports, which impacts investor sentiment and business profitability, ultimately decreasing market participation. However, studies that focus on the stock market and exchange rate generally produced contradictory findings, stating of negative and positive impact, with studies by Moussa and Delhoumi (2021)and Jawaid and Ui Haq (2012) showing positive and significant impact, whereas thenegative impact has been identified in the research undertaken by Khan (2019).With a 0.07% drop in stock traded for every 1% increase in inflation, the long-term and substantial impact of inflation (LnIn) on the stock market (LnSM) suggests a decline in investor confidence. Excessive inflation reduces buying power, raises expenses, and breeds economic ambiguity, all of which deter investment. Over time, this results in decreased stock market activity and fewer company earnings. These findings were supported by the earlier findings of Uwubanmwen (2015). This was in contradiction to the findings of Kwofie and Ansah (2018).
The findings of the ARDL approach in the short run are given in Table 7. The coefficient of the error correction term indicates the pace of adjustment from the short to the long term for any disequilibrium and long-term causality correlations. Error correction is important. According to the coefficient of the ECM, which is -4.698, the current year’s correction for errors and shocks from the previous year will be made at a rate of 46.98%. The results of the short-term impact analysis show that LnGF has the highest positive effects on the stock market (LnSM), with coefficient values of 0.49. Following green finance, LnAI. LnFDI, LnEx, LnIn and LnDC also affect the stock market (LnSM)
positively with coefficient values of 0.58, 0.35, 0.38, 0.26, and 0.15 respectively. However, trade negatively affected the stock market in the short run with a 1% increase in trade (LnTr), which decreased the stock traded by 0.24. The short-term negative impact of trade (LnTr) on stock traded (LnSM) is caused by the potential changes or disruptions that arise with an increase in trade. In the short term, increased trade volumes may lead to market volatility as businesses adjust to changes in supply, demand, or external factors like trade agreements or tariffs. Stock trading activity may decrease as investors become more cautious due to this uncertainty.
Robustness Check
The findings of the long-run panel ARDL estimation were validated by employing Driscoll Kraay Standard Error (DKSE), Augmented Mean Group (AMG), and Common Correlated Effects Mean Group (CCEMG) estimation. As shown in Table 8, the results are consistent with the panel ARDL estimation. The estimation of DKSE, AMG, and CCEMG confirmed that LnGF, LnAI, LnFDI, and LnTr have a significant positive impact on LnSM in the long run. For instance, a one percent increase in LnGF increases LnSM by 0.54, 0.71, and 0.62 according to DKSE, AMG, and CCEMG, respectively.
Additionally, as indicated by the panel ARDL findings, LnEx and LnIn have a negative impact, though LnEx has a negative impact; it is an insignificant impact on LnSM. Therefore, it can be concluded that the findings of DKSE, AMG and CCEMG are consistent with the output of the panel ARDL model.
CONCLUSION
to have a positive impact on the stock market in the short term, with green financing having the highest impact, followed by AI and FDI. However, trade has a short-term negative impact, most likely because of volatility, adjustment frictions, or transient uncertainty that come with increasing trading activity. A stable long-term equilibrium is confirmed by the considerable and negative error correction term, which also shows a robust adjustment speed towards equilibrium following short-term shocks. The study’s conclusions have numerous significant policy ramifications. First, governments and financial institutions can encourage sustainable finance by increasing green financial instruments, providing tax breaks, and enforcing open environmental reporting requirements, as evidenced by the positive impact of green financing on the stock market. In addition to advancing environmental goals, this will boost investor confidence and stock market stability. Second, given AI’s significant impact on stock market performance, more funding should be allocated to digital infrastructure, fintech innovation should be encouraged, and regulatory frameworks that permit the safe and moral integration of AI technology into financial markets should be established. Third, legislators should improve political stability, regulatory effectiveness, and investor protection measures to guarantee a favourable investment climate as FDI continues to
have a favourable impact on the market. Fourth, even if trade has long-term advantages, its short-term volatility highlights the significance of creating policies that support trade while shielding home markets from sudden shocks, maybe through risk mitigation and adaptive trade techniques.
REFERENCES
Dino. (2023). The Effect of Trading Volume on Stock Price. Gettysburg College Institutional Repository. https://cupola.gettysburg.edu/cgi/viewcontent.cgi?article=103 2&context=gchq
spatially dependent panel data. Review of Economics and Statistics, 80(4), 549
560. https://doi.org/10.1162/003465398557825
panels. Economic Modelling, 29(4), 14501460. https://doi.org/10.1016/j.econmod.2012.02.014
Eberhardt & Teal. (2010). Productivity analysis in global manufacturing production. Economics Series Working Papers 515, University of Oxford, Department of Economics.
Enisan, A. A., & Olufisayo, A. O. (2009). Stock market development and economic
growth: Evidence from seven sub-Sahara African countries. Journal of Economics and Business, 61(2), 162 171. https://doi.org/10.1016/j.jeconbus.2008.05.001
Fosu, O. A., & Magnus, F. J. (2006). Bounds testing approach to Cointegration: An
examination of foreign direct investment trade and growth relationships. American Journal of Applied Sciences, 3(11), 20792085. https://doi.org/10.3844/ajassp.2006.2079.2085
Ganguly, S., & Bhunia, A. (2022). Testing volatility and relationship among BRICS
stock market returns. SN Business & Economics, 2(8). https://doi.org/10.1007/s43546-022-00267-6
Gujarati, D. N. (2009). Basic Econometrics. Hassan, A. Y., & Mohamed, M. A. (2024). Dynamic impacts of economic and environmental performances on agricultural productivity in Somalia: Empirical evidence from ARDL technique. Cogent Food & Agriculture, 10(1). https://doi.org/10.1080/23311932.2024.2369204
Im, K. S., Pesaran, M. H., & Shin, Y. (2003). Testing for unit roots in heterogeneous
panels. Journal of Econometrics, 15, 53-74. https://doi.org/0.1016/S0304
4076(03)00092-7
Jawaid, S. T., & Ul- Haq, A. (2012). Effects of interest rate, exchange rate and their
volatilities on stock prices: evidence from banking industry of
Pakistan. Theoretical and Applied Economics, 153-166.
Joo, B. A., & Shawl, S. (2023). Understanding the relationship between foreign direct
investment and economic growth in BRICS: Panel ARDL approach. Vikalpa: The
Journal for Decision Makers, 48(2), 100113. https://doi.org/10.1177/02560909231180078
Khan, M. K. (2019). Impact of exchange rate on stock returns in shenzhen stock
exchange: analysis through ARDL approach. International Journal of Economics
and Management, 1(2), 15-26.
Khelfaoui, I., Xie, Y., Hafeez, M., Ahmed, D., Degha, H. E., & Meskher, H. (2022).
Information communication technology and infant mortality in low-income
countries: Empirical study using panel data models. International Journal of
Environmental Research and Public Health, 19(12),7338. https://doi.org/10.3390/ijerph19127338
Kwofie, C., & Ansah, R. K. (2018). A study of the effect of inflation and exchange rate
on stock market returns in Ghana. International Journal of Mathematics and
Mathematical Sciences, 2018, 1-8. https://doi.org/10.1155/2018/7016792
Lehkonen, H., & Heimonen, K. (2014). Timescale-dependent stock market
comovement: BRICs vs. developed markets. Journal of Empirical Finance, 28,
90-103. https://doi.org/10.1016/j.jempfin.2014.06.002
Levine, R., & Zervos, S. (1999). Stock markets, banks, and economic growth. Policy Research Working Papers.. https://doi.org/10.1596/1813-9450-1690
Li, Y., & Lin, A. (2024). Assessing the impact of green finance on financial performance in Chinese eco-friendly enterprise. Heliyon, 10(7), e29075. https://doi.org/10.1016/j.heliyon.2024.e29075 Mohanram, P. S. (2005). Separating winners from losers among lowbook-to-Market stocks using financial statement analysis. Review of Accounting Studies, 10(2-3), 133-170. https://doi.org/10.1007/s11142-005-1526-4
Moussa, F., & Delhoumi, E. (2021). The asymmetric impact of interest and exchange rate on the stock market index: Evidence from MENA region. International Journal of Emerging Markets, 17(10), 2510 2528. https://doi.org/10.1108/ijoem-01-2020-0089
Mroua, M., & Trabelsi, L. (2020). Causality and dynamic relationships between exchange rate and stock market indices in BRICS countries. Journal of Economics, Finance and Administrative Science, 25(50), 395 412. https://doi.org/10.1108/jefas-04-2019-0054
Nyasha, S., & Odhiambo, N. M. (2020). Determinants of the Brazilian stock market development. The Journal of Developing Areas, 54(1). https://doi.org/10.1353/jda.2020.0003
Pagliaro, A. (2023). Forecasting significant stock market price changes using machine learning: Extra trees classifier leads. https://doi.org/10.2139/ssrn.4416226
Panopoulou, E., & Pittis, N. (2004). A comparison of autoregressive distributed lag and dynamic OLS cointegration estimators in the case of a serially correlated cointegration error. The Econometrics Journal, 7(2), 585 617. https://doi.org/10.1111/j.1368-423x.2004.00145.x
Pedroni, P. (1999). Critical values for Cointegration tests in heterogeneous panels with multiple Regressors. Oxford Bulletin of Economics and Statistics, 61(s1), 653 670. https://doi.org/10.1111/1468-0084.0610s1653
Qamruzzaman, M., & Wei, J. (2018)Financial innovation, stock market development, and economic growth: An application of ARDL model. International Journal of Financial Studies, 6(3), 69. https://doi.org/10.3390/ijfs6030069
R. Iram, J. Zhang, S. Erdogan, Q. Abbas, M. Mohsin. (2020). Economics of energy and
environmental efficiency: evidence from OECD countries Environ. Sci. Pollut. Control Ser..
Raihan, A., Bala, S., Akther, A., Ridwan, M., Eleais, M., & Chakma, P. (2024). Advancing environmental sustainability in the G-7: The impact of the digital economy, technological innovation, and financial accessibility using panel ARDL approach. Journal of Economy Technology. https://doi.org/10.1016/j.ject.2024.06.001
Sreenu, N. (2023). Effect of exchange rate volatility and inflation on stock market returns dynamics – evidence from India. International Journal of System Assurance Engineering and Management, 14(3), 836 843. https://doi.org/10.1007/s13198-023-01914-3
Tejesh, H. R. (2020). Impact of inflation and exchange rate on stock market returns in India: An ARDL approach. Theoretical and Applied Economics, 31(2), 25- 36.
Toloraya, G. (2018). The BRICS for better global governance. BRICS and Global Governance, 187-207. https://doi.org/10.4324/9781315569925-10
Uwubanmwen, A. and Eghosa, I.L. (2015). Inflation Rate and Stock Returns: Evidence from Nigerian Stock Market. International Journal of Business and Social Science, 6(11), 155- 167.
Wang Y., & Zhong, Y. (2022). Green financial development and enterprise innovation. Journal of Finance and Economics, 8(3), 1-15.
Yu, M., Umair, M., Oskenbayev, Y., & Karabayeva, Z. (2023). Exploring the nexus between monetary uncertainty and volatility in global crude oil: A contemporary approach of regime-switching. Resources Policy, 85, 103886. https://doi.org/10.1016/j.resourpol.2023.103886
Zhang, Z., & Ding, Y. (2023). The impact of green financial development on stock price crash risk from the perspective of information asymmetry in Chinese listed companies. Environmental Science and Pollution Research, 30(37), 87199 87214. https://doi.org/10.1007/s11356-023-27771-y